


Predicted Targets Page
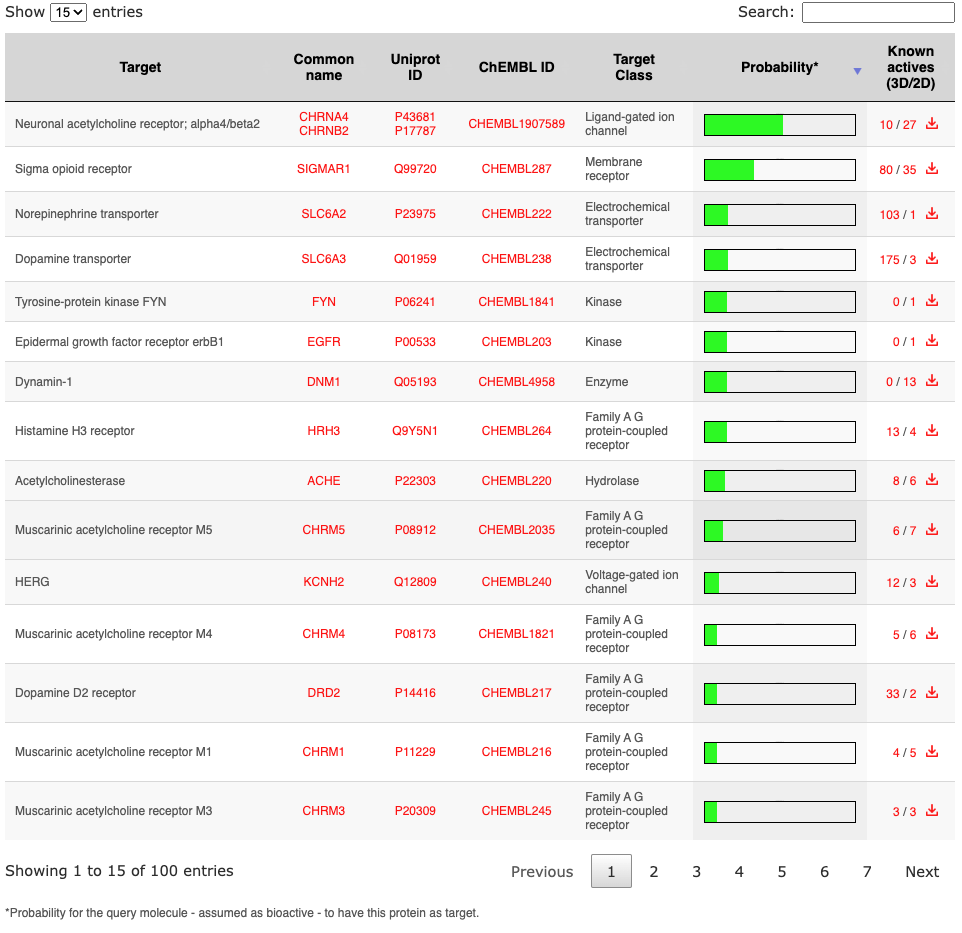
This is the main result page. The chemical structure of the query molecule is displayed in a first box together with interoperability icons allowing to submit the molecule to other in house web tools.A dynamic table ranks the predicted targets for the query molecule. The table can be sorted according to any column (by clicking the corresponding header), extended by number of rows (top left), text searched (top right) or paginated (bottom right). The protein targets are described by name, gene name (link to Genecards database), Uniprot ID (link to Uniprot database) and ChEMBL ID (link to ChEMBL database) in the first fourth columns. Targets are classified in the fifth column based on their classes, which are summarized in a pie chart in the top of the page. The chart can be reprensented for the top-ranked or for all predicted targets. The default is 'Top 15', this can be changed by clicking 'Top XX' on its left.
The green bar is the probability for the protein to be a target of the query molecule, which is assumed as bioactive. Value equal to 1 often indicates that the query molecule is actually a known active.
The known active compounds on each target showing the highest similarity (above 0.65 for 2D or above 0.85 for 3D) can be browsed by following the corresponding link in the column 'Known actives' (numbers, which indicate how many such known actives will be displayed).
Clickable snapshot